
What Barclays/Lloyds wrist slap means for Open Banking APIs

Hannover Re Corporate clip
London fintechs flock to Lithuania post-Brexit

Dominique Roudaut
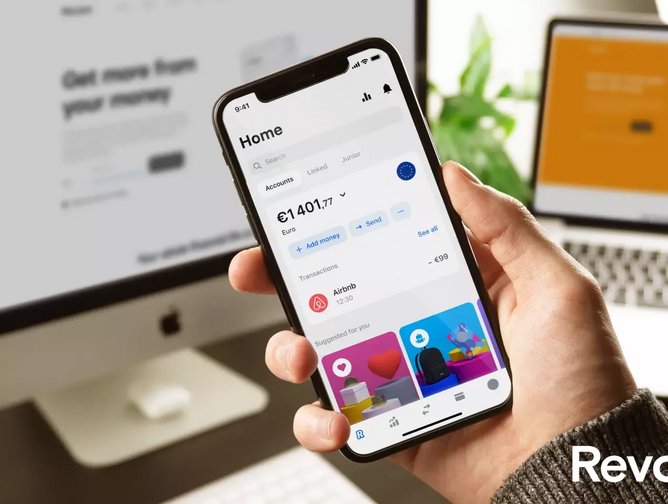
Revolut secures retail trading US broker-dealer license

Barclays Appoints CEO of Germany Dr Ingrid Hengster

Is the UK falling behind when it comes to open banking?

TECH LIVE LONDON: Begins tomorrow at 10am!

FinTech & InsurTech LIVE: Diversity in the sector